Class Reports
The main Reports page shows a Lexile distribution chart, top and bottom skills list, and a class activity table. Lexile Distribution is a snapshot of your class’s Lexile reading measures. Top and Bottom Skills shows your students’ three highest-performing and three lowest-performing skills based on quiz answers. The Class Activity table shows average Lexile growth, time spent reading, books completed (with and without audio), quizzes taken, and average quiz scores.
Fine-tune the data you see by using the filters at the top of the page: date range, grade level, language, and reading group. The default date range is "Last 90 Days," but you can customize it to any dates you choose. Use the grade level filter to see only students within a particular grade. Adjust the date range to compare data week to week or month to month. Use the language filter to see just data for English, Spanish, or bilingual books and quizzes completed. Filter by group to view data only for a specific reading group. You can switch between options in this filter to compare subsets of students.

If you have more than one classroom, you’ll see an additional filter between the language and group filters:
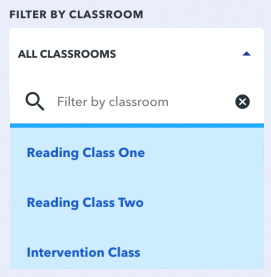
This filter allows you to to view data for a specific class or range of classes. The default Reports setting is for all classes.
LevelUp Reader enables you to export report data. Click "Export activity data" in the upper right of the Class Activity table, then click Export CSV in the pop-up window that opens. After a moment, your browser will download a file in .csv format, which can be opened in any spreadsheet application. Before you export data, check the date range, language, and (if applicable) classroom filters to be sure you are exporting exactly the data you want. Each row of the exported sheet lists data for an individual student.
In the Top and Bottom Skills table, click "See Full Breakdown of Skills and Standards" to open an exhaustive list of how students performed on comprehension skills and ELA standards. Sort the columns on each table to see which skills and standards students have mastered and which might require more attention. In the standards table, hover over a standard code to see the full text of that standard.